Unlocking Peak Performance: A Deep Dive into the TradingView Desktop
For the serious trader, the trading environment is paramount. While web-based platforms offer convenience, a dedicated application provides the speed, stability, and raw power necessary for high-level market analysis. The TradingView Desktop platform* stands as the ultimate hub for traders, integrating a suite of sophisticated tools designed to provide a decisive edge. It is a comprehensive, cloud-based application that merges professional-grade chart analysis, extensive market data, and seamless trade execution into a single, powerful ecosystem. By harnessing the capabilities of the TradingView Desktop, traders can move beyond casual observation and engage with the markets on a profoundly deeper level.
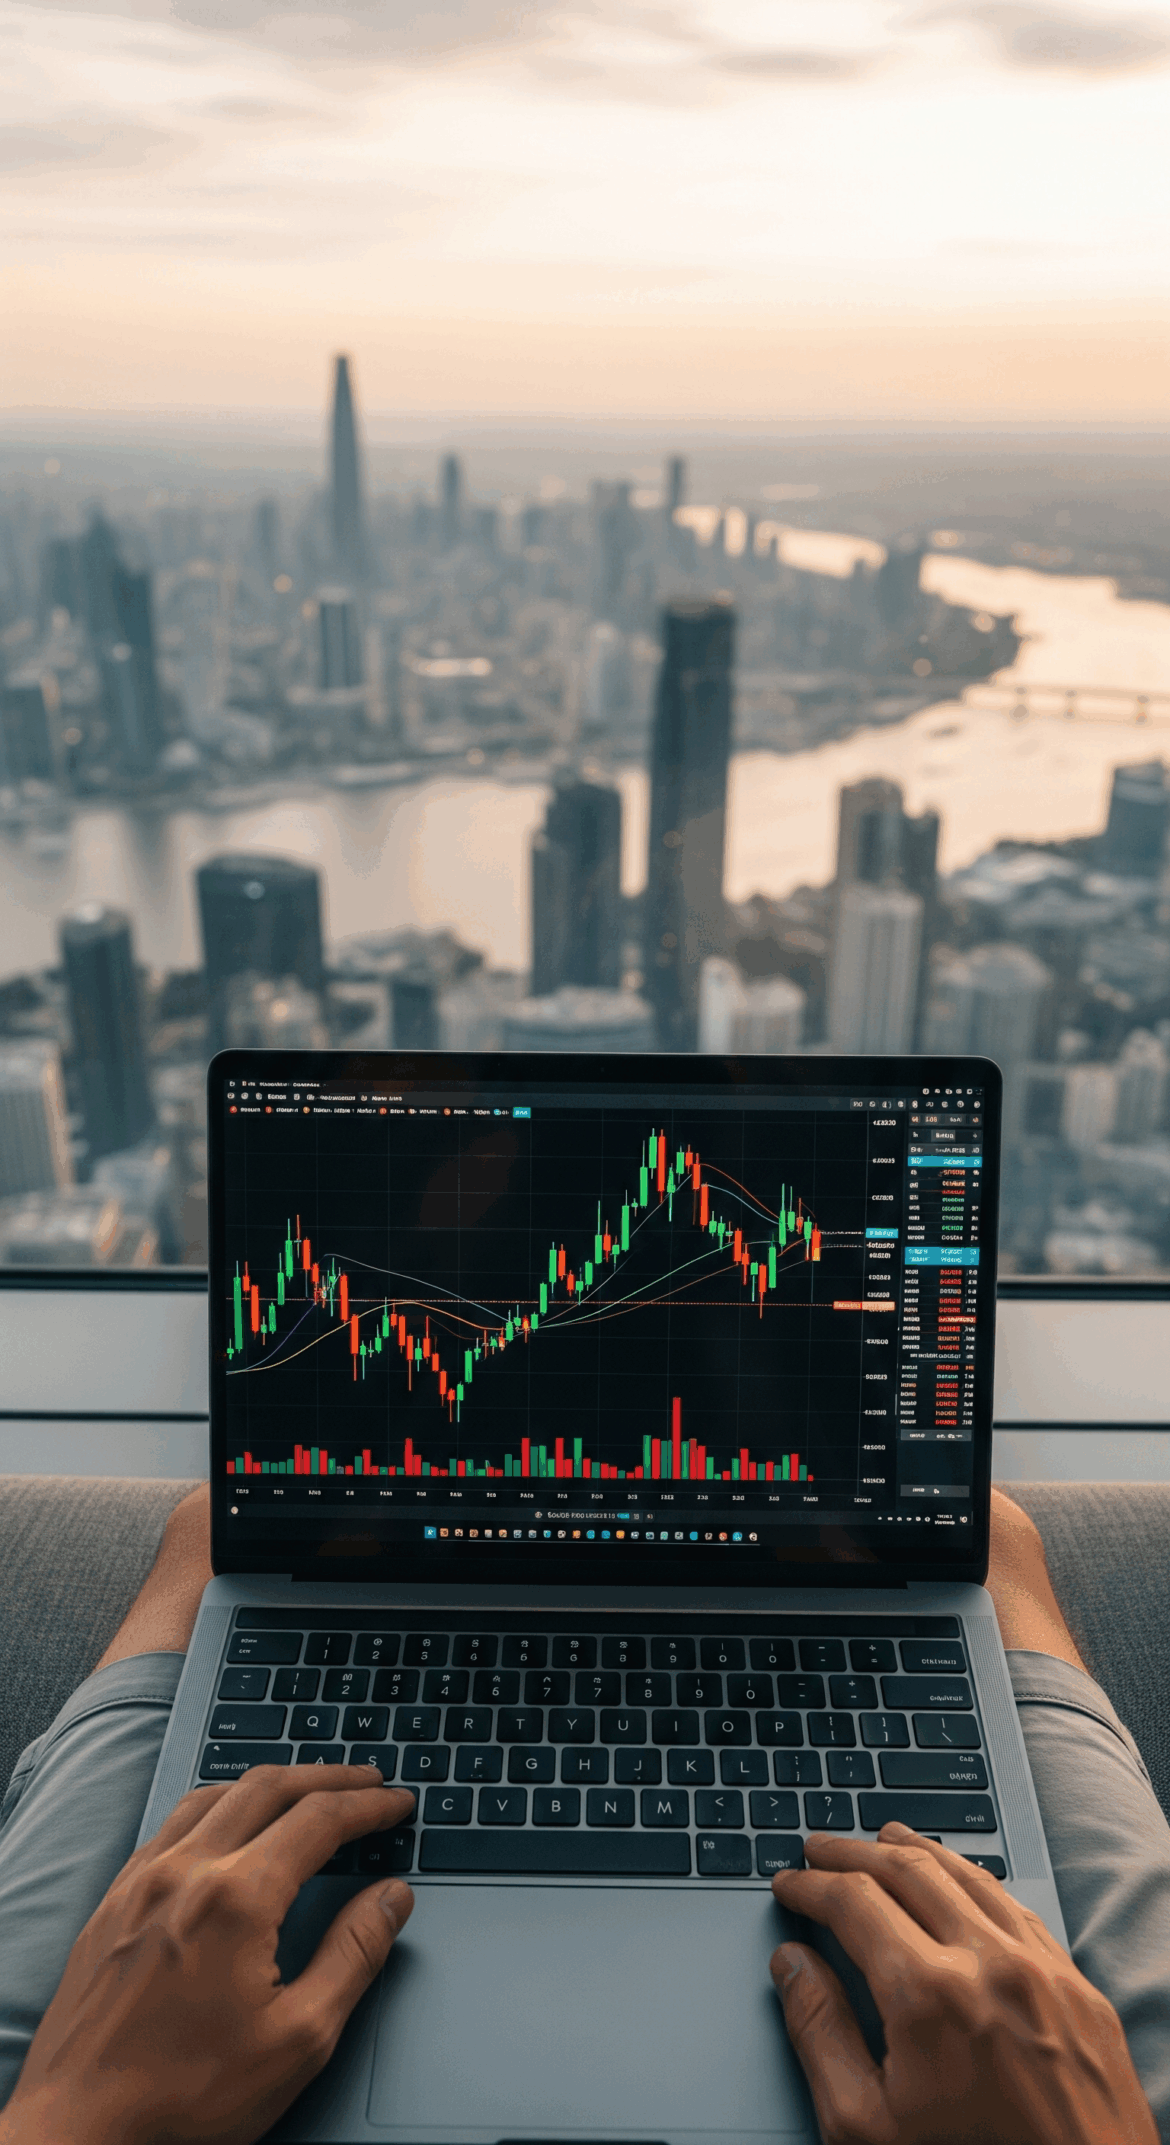
The Core of Analysis: A Charting Powerhouse
At the heart of the TradingView Desktop experience lies its unparalleled charting platform*, which offers an incredible depth of customization and analytical power. This is not merely a window to view prices; it is an interactive canvas for dissecting market dynamics. Advanced features allow traders to construct a comprehensive view tailored to their specific strategies.
One of the standout features is the ability to display up to 16 charts within a single screen. This is essential for professionals who employ multi-timeframe analysis (MTFA), allowing for the simultaneous comparison of different assets or market conditions across various time horizons. To streamline workflow, a global search operator enables users to execute commands like adding indicators or changing symbols with quick keyboard inputs, eliminating the need for cumbersome mouse navigation.
The platform also empowers traders to create custom formulas, known as Spreads. This allows for the charting of relationships between assets, such as the difference between Gold and Silver, or the application of other mathematical operations to uncover unique insights. Furthermore, the availability of custom intervals, ranging from seconds to range bars, is crucial for the precision required in day trading and scalping strategies.
Beyond standard candlesticks, the TradingView Desktop provides a suite of advanced chart types designed to reduce market noise and illuminate underlying trends. These include:
- Heikin Ashi: This chart type smooths out significant price swings, making it easier to identify and follow trend movements by minimizing market noise.
- Renko: By focusing purely on price movement instead of time, Renko charts draw “boxes” of a fixed size, making them ideal for visualizing trends and identifying key breakouts.
- Point & Figure: This classic chart type ignores both time and volume, representing price increases with ‘X’s and decreases with ‘O’s to focus on critical price levels and trend reversals.
Unrivaled Technical and Fundamental Analysis
The TradingView Desktop provides the foundation for robust technical analysis (TA)*. It comes equipped with over 400 built-in indicators and strategies, including standards like MACD, RSI, and moving averages. This library is exponentially expanded by the active community, which has published over 100,000 public indicators using the proprietary Pine Script® language. Automated tools for candlestick pattern recognition and Volume Profile indicators further accelerate the process of identifying complex patterns and crucial volume zones.
However, modern trading requires more than just technical prowess. The platform seamlessly integrates deep fundamental analysis. Traders can overlay key financial metrics like revenue, P/E ratios, and EPS directly onto their charts. The application provides access to over 100 fundamental indicators and all major financial statements for comprehensive company analysis. To navigate the complex world of macroeconomics, tools such as a built-in economic calendar, yield curve charts, and specialized market maps help traders understand global economic trends that influence asset prices.
Customization, Backtesting, and Strategy Refinement
Perhaps the most powerful aspect of the TradingView Desktop is its capacity for infinite customization through Pine Script®*, a minimalist programming language developed by TradingView specifically for traders. This simple language allows users to build complex, custom indicators and automated trading strategies. The integrated Pine Editor acts as a full-fledged cloud IDE with features like autocomplete, making development intuitive.
Ideas are worthless without validation. The platform’s “Bar Replay” function is an essential tool for backtesting*. It allows traders to play back historical market data bar-by-bar, letting them practice their strategies and train their analytical eye in a simulated environment. Using strategy scripts written in Pine Script®, one can conduct deep backtests on historical data to precisely measure key performance and risk metrics like net profit and drawdown. The platform also offers a risk-free paper trading account* with virtual funds, allowing for the simulation of trading strategies before committing real capital.
From Analysis to Execution
TradingView Desktop closes the loop by integrating seamless trade execution. It is not just an analysis tool but a fully functional trading station with direct connections to over 100 trusted brokers. This allows for complete chart trading, where orders can be placed, modified via drag-and-drop, and managed directly from the chart interface.
To ensure no opportunity is missed, the platform features a robust alert system. Users can set cloud-based alerts on prices, indicators, drawings, or even their own custom Pine Scripts®. Because these alerts run on TradingView’s servers, they remain active even when the application is closed.
By combining elite charting, deep data analysis, limitless customization, rigorous backtesting, and integrated execution, the TradingView Desktop* provides a truly all-in-one solution for traders who demand performance and precision.
Schreibe einen Kommentar